
Depleted Uranium Statistics – How Much Is There?
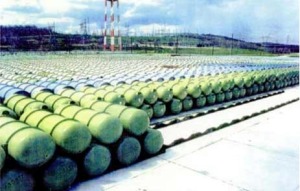
Depleted Uranium Storage in the USA (image: Depleted UF6 Management Information Network, US Govt)
The statistics featured below were originally featured in the facts + figures section of BlatantWorld.com. The data itself was sourced from the WISE Uranium Project, regarded by some as the most accurate and up-to-date list of Depleted Uranium stocks around the World.
As this is the latest data available, we can only be sure of 1 thing; that these stockpiles have grown, and they are most probably substantially larger than what the figures quoted below represent.
ABOUT THE STATS: The data below was last updated by WISE on the 21st of April 2008, and remains the latest available, as of January 29th 2012. The United States’ figures are for mid-2000, Russia’s estimate is based on “Depleted Uranium from Enrichment, Uranium Institute, London 1996”, China’s estimate is for the end of 2000, Japan’s estimate is for February 2001, and the rest are based on 1999 year-end estimates.
| Country | Organisation | Total Stock/tonnes |
| United States | United States Department of Energy | 480,000 |
| Russia | Rosatom Nuclear Energy State Corporation | 460,000 |
| France | Areva NC | 190,000 |
| United Kingdom | British Nuclear Fuels plc | 30,000 |
| Germany, Netherlands & United Kingdom |
Urenco Group | 16,000 |
| Japan | Japan Nuclear Fuel Ltd. | 10,000 |
| China | China National Nuclear Corporation | 2,000 |
| South Korea | Korea Atomic Energy Research Institute | 200 |
| South Africa | South African Nuclear Energy Corporation | 73 |
Originally sourced from: Depleted Uranium Inventories @ WISE Uranium Project
Leave a reply