Continental Population Growth Around The World 2015-2100

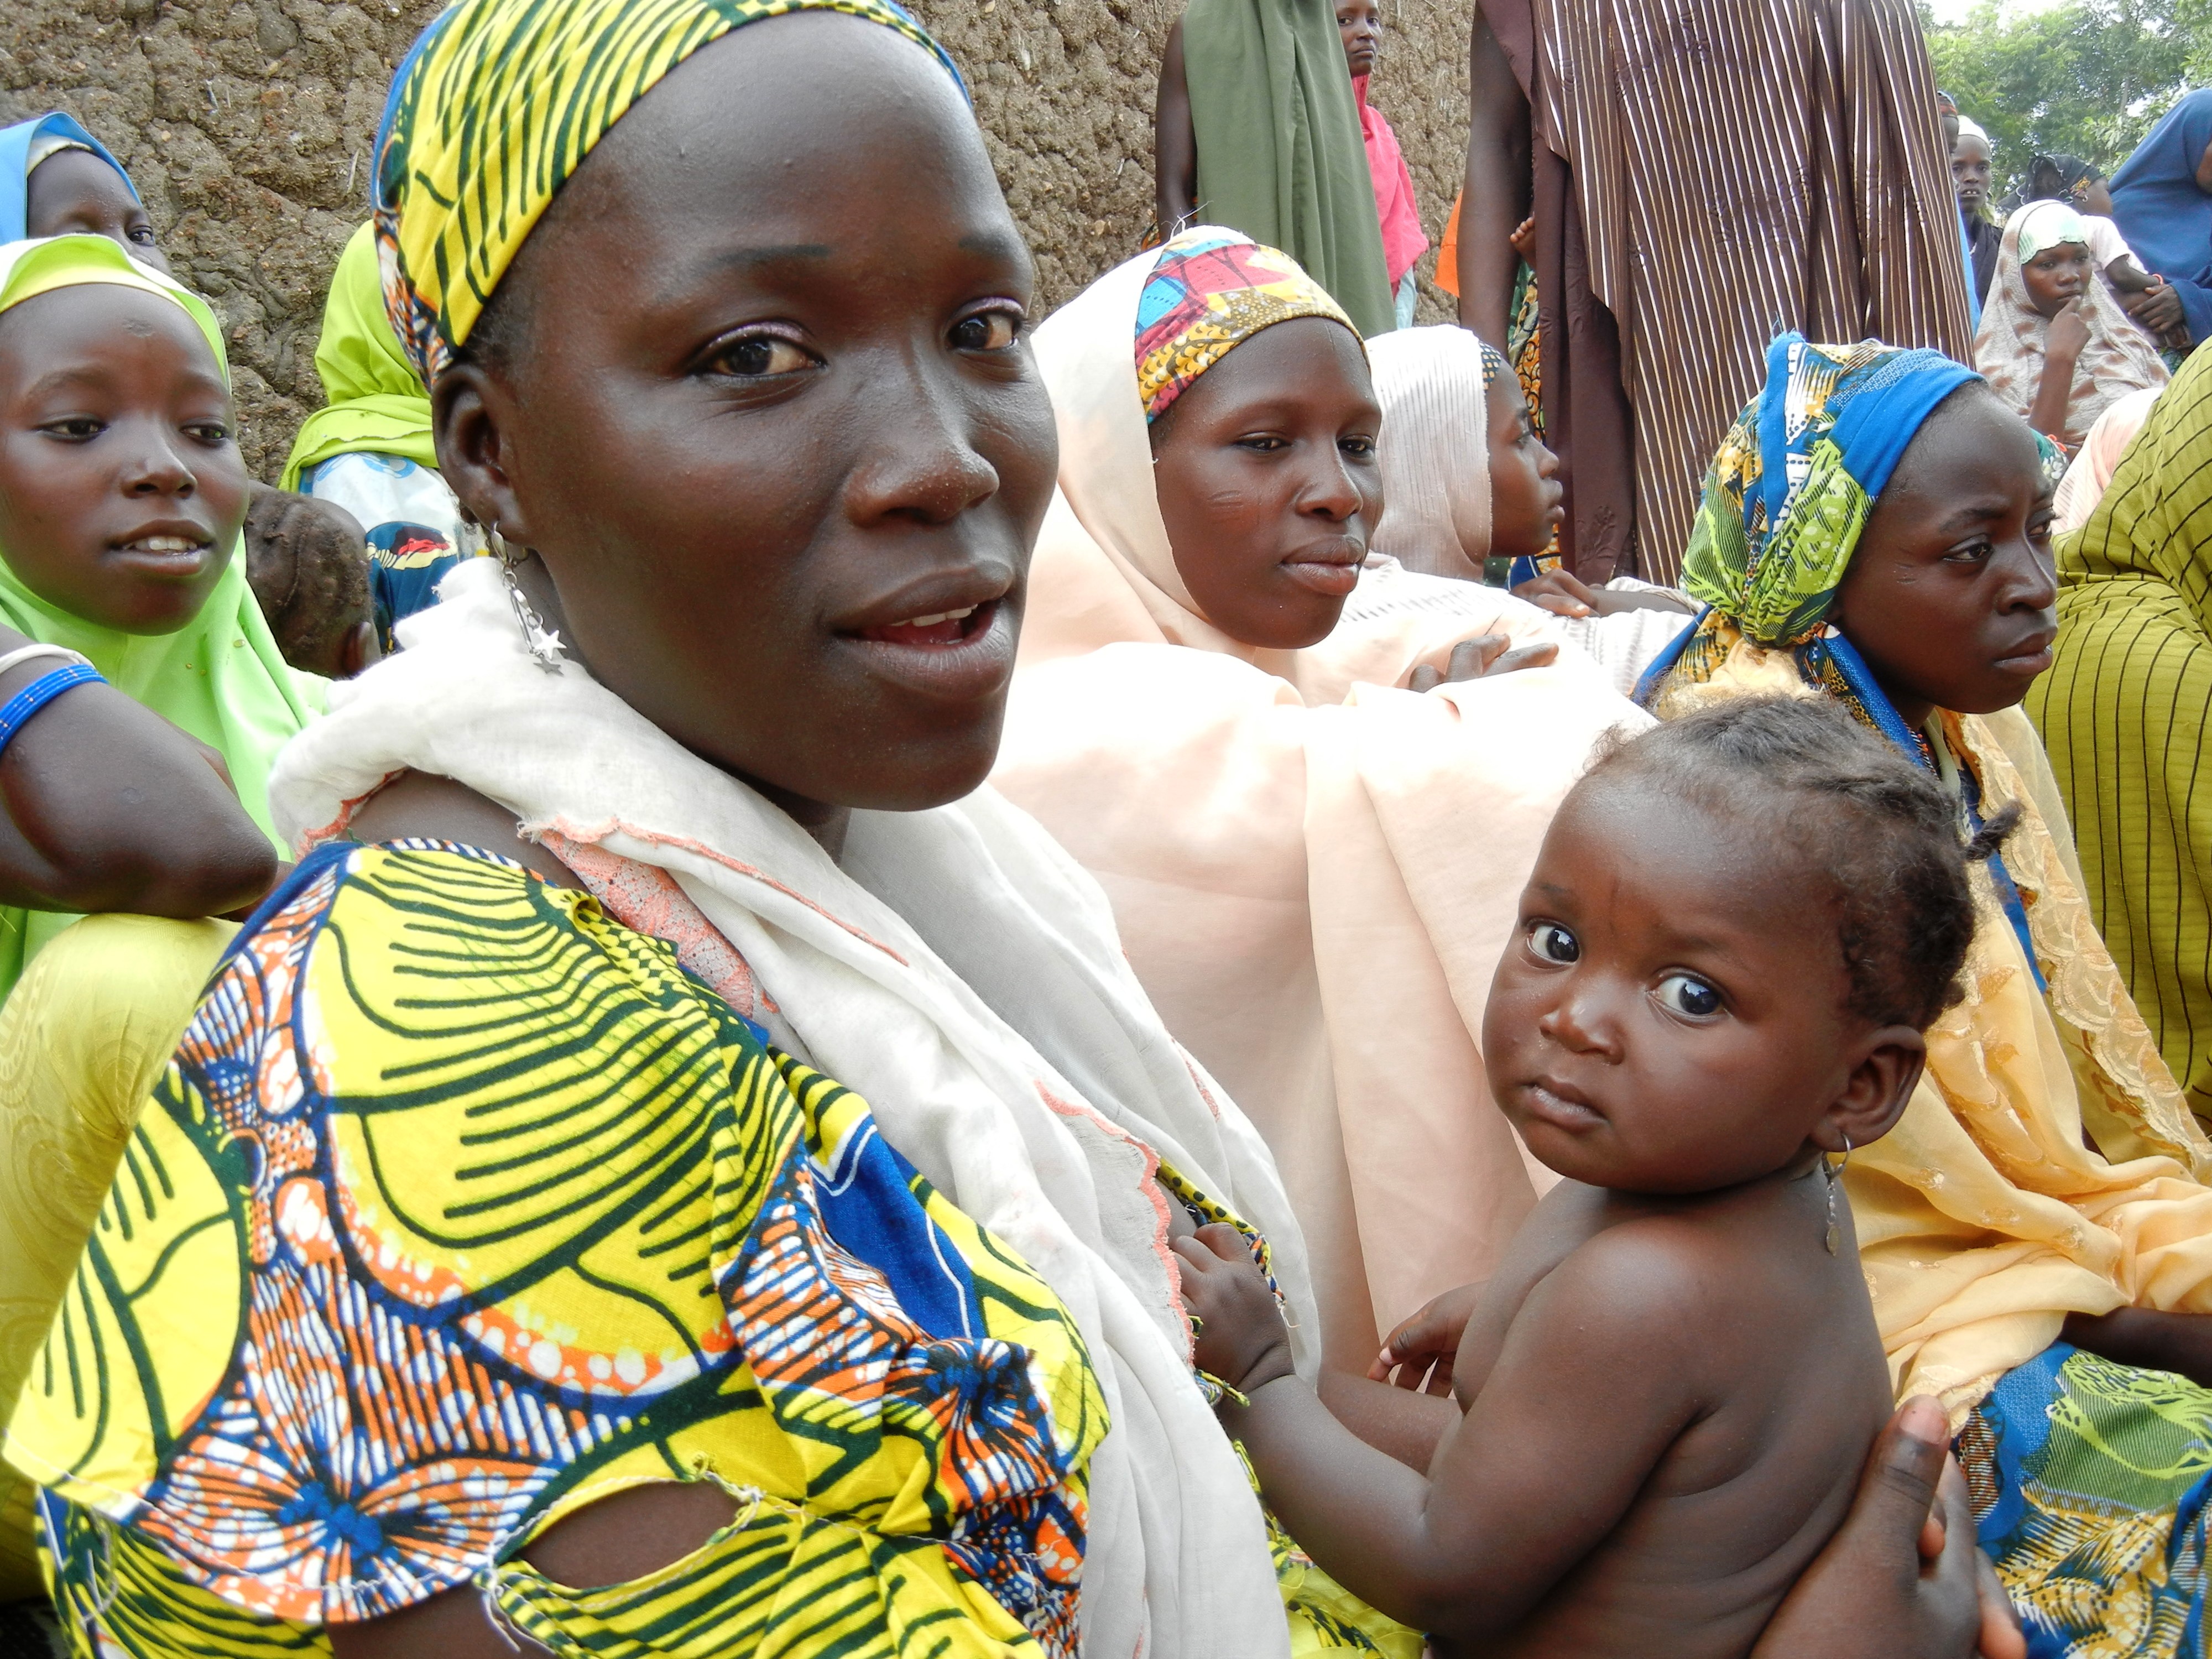
Women and Kids at Health Clinic in Northern Nigeria, Africa (image: DFID – UK Department for International Development)
This chart depicts the estimated population changes, between 2015 and 2100, for all of the continents, according to the popular six continent model.
As you can see, the UN regional population projections depict – in general – that Asia will tail off in the middle of the century, with Africa gaining significant new numbers of people in the second half of the century.
These totals have been put together by the United Nations Population Division, as part of their latest revision of the ‘World Population Prospects’.
Please note – the following table is best viewed on tablets or full-sized screens. It may not be 100% viewable on some mobile devices due to its formatting, although if you rotate your mobile screen to view it horizontally, that may do the trick!
Continental Population around the World
All figures in millions; 1,000 = 1 billion
| Continent | 2015 [1] | 2025 [1] | 2050 [1] | 2100 [1] |
| Asia | 4,384.8 | 4,748.9 | 5,164.1 | 4,711.5 |
| Africa | 1,166.2 | 1,468.0 | 2,393.2 | 4,184.6 |
| Europe | 743.1 | 741.0 | 709.1 | 638.8 |
| North America | 576.2 | 628.5 | 722.7 | 781.8 |
| South America | 415.1 | 452.3 | 505.1 | 467.5 |
| Oceania | 39.4 | 44.7 | 56.9 | 69.6 |
| World | 7,324.8 | 8,083.4 | 9,550.9 | 10,853.8 |
[1] “Total population, both sexes combined” by UNdata, the statistical division of the United Nations. This data was put together by the Department of Economic and Social Affairs – Population Division, Populations Estimates, Projections Section. This data forms part of “World Population Prospects: The 2012 Revision“, the latest available data from the United Nations. Data last updated by the UNdata on 20 August 2013.

Leave a reply